Following the piloting process of Advanced Manufacturing Labs for H/VET through the Collaborative Learning Factory (hereafter CLF), the EXAM4.0 partners we have piloted 16 technologies embedded in Industry 4.0.
The following image shows the overall structure of the piloting process.
Labs for Advanced Manufacturing-CLF
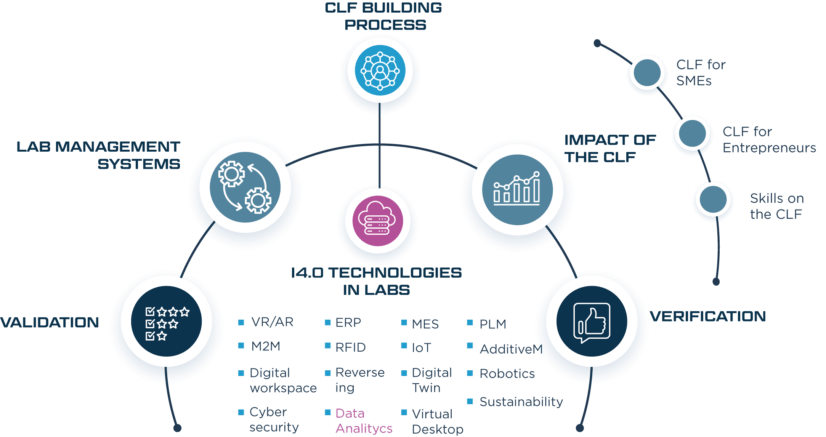
The present report is the one out of 16 I4.0 technology described within the “Industry 4.0 technologies in labs” section, specifically on #1 Data Analytics.
DEFINITION AND APPLICATION OF DATA ANALYTICS IN INDUSTRY
Data analytics is meant to be the process and the technique with which raw data is analysed in order to draw conclusions. In earlier years, data analytics was done manually, but this domain of expertise has been developed and currently most of the processes are automated into mechanical processes and algorithms.
Data analytics is a broad term. With a range of data analytic techniques, different kinds of information can be analysed to get insight in the processes to be improved. Data analytic techniques can be used to reveal metrics and trends, which easily could be lost in the mass of information. This information can then be used to optimize processes to increase the overall efficiency of a business or a system.
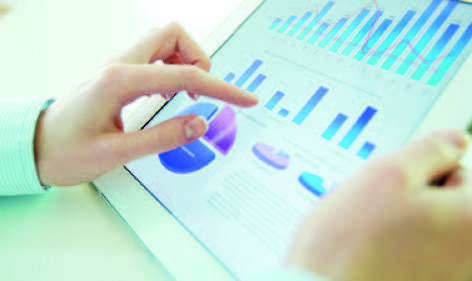
Figure 1: Data Analytics. Source: edX
Coupled with the rapid development of artificial intelligence, advanced analytics, robotics, emerging IoT-powered sensors and devices, Industry 4.0 offers manufacturers the ability to gather, store, process as well as utilize data in daily operations. Furthermore, business intelligence and business analytics help to draw insights about potential improvements. (Vyas, 2021) The results are tangible: from increased quality to cost savings and minimized emissions. (Birand, 2021)
In industry for example companies can record the runtime, downtime, and work queue for various machines and then analyse the data to better plan the workloads. Furthermore, predictive data analytics is used for predictive maintenance (forecasting when the equipment fails to perform a task). And there are many more applications in which data analytics can be used for improvement of processes. On the other side, we need also to remember the fact that one of the biggest problems for an organization is the lack of talent to understand data and how to analyze it and apply that learning to specific business cases. (Dib, 2021)
DATA ANALYTICS WORKPLACE IN HVET/VET LABS
In this section we describe how Data Analytics can be incorporated in VET/HVET school’s labs. Different options and applications are described.
There are different learning possibilities when it comes to Data Analytics in schools. A wide range of devices, systems and processes can be used as a source of data. These can be based on fictitious situations as well as real situations. The data source that will be used depends on the learning goals; is your focus on collecting data, analysing data, interpretation of data or the whole process. Furthermore, the lab will give the opportunity to analyse data from existing systems as well as new systems. The latter will give learners the possibility to go through the whole
Data Analysis process from defining the data analysis goal till the interpretation of results and even the application of adjustments. Coming to educational institutions, another relevant application field for data analytics is its use to improve the learning processes of the students, in a similar way as the Learning Analytics discipline proposes. Learning analytics is the measurement, collection, analysis and reporting of data about learners and their contexts, for purposes of understanding and optimizing learning and the environments in which it occurs (SoLAR Society for Learning Analytics Research, 2011).The term Learning Analytic is widely used to evaluate teaching and learning in online environments. However, in Learning Factory environments, we can also have a lot of data related to the learner’s performance that could be used to improve their particular process. Data coming from machines, equipment, and other systems as MES-ERP-PLM can be linked to the students. This data can later be processed, tracked and monitored.
Within the Sustainability Factory (Duurzaamheidsfabriek) it is possible to gain the Data Analytics knowledge and skills by using data sets of real machines and processes. For example with the Xcaliber flow loop in the Flowcenter of Excellence FCoE.
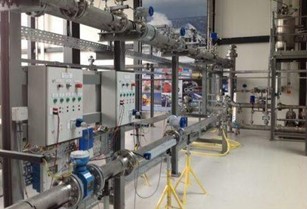
Figure 2: Xcaliber flow loop in the Sustainability Factory Source: Author‘s creation
This flow loop is located on the ground floor of the Sustainability Factory and offers a platform to support and facilitate industry and education. This regards metrology as such, i.e. the measurement of liquid flows in all aspects, including calibration. Furthermore, this involves testing/training and/or education w.r.t. (new) products and technologies, where a dynamic flow forms the context, like the process industry and maritime industry. Several datasets are created on the XCaliber flow loop. They provide readings from a wide array of instruments and actuators available on the XCaliber flow Loop. They contain various intervals (approximately after 3 minutes) where air is introduced into the system. They are time-series recorded from the Schneider SCADA system of XCaliber using APM-Studio.
Another FCoE installation used for Data Analytics research, training and education is the Dynamic Maritime Test Facility (DMTF). This loop offers its users a dynamic environment to test and/or research developments in maritime propulsion technology in a streaming water (i.e. flow) situation. With the TT-Sense ® implemented in the drive line, both thrust and torque at the shaft can be measured. In combination with shaft speed (rpm), flow speed and engine power, the performance of the propulsion line as a whole can be analysed and optimized.
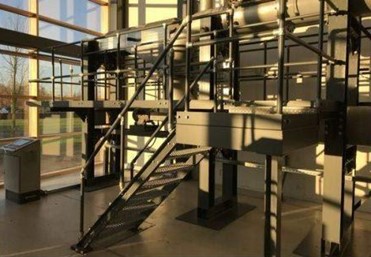
Figure 3: FigureThe Dynamic Maritime Test Facility in the Sustainability Factory. Source: Author’s creation
The partners in the industry as well as the students that make use of the Sustainability Factory can use the datasets for development of prognostic algorithms and exploratory analysis.
USE CASES
The system implemented in the machining lab at Miguel Altuna allows the data acquisition of machines, tools and equipment use. The systems link learners and their learning process to the usage of lab’s equipment. Thanks to the data analytics systems, three aspects are covered: i) improvement of the efficiency of the equipment ii) use of data by students to improve their projects and performances iii) tracking of students’ learning processes. For further information refer to EXAM4.0, 3 I4.0 technology #7:-M2M (EXAM4.0, 2021)
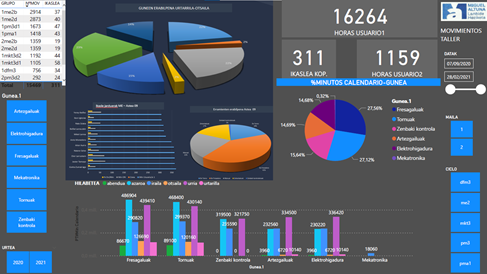
Figure 4: Graphics from Miguel Altun’s labs machine usage. Source: Miguel Altuna
USE CASES
As described in the EXAM4.0 AM lab piloting documents, the affiliate VET centre IMH from the Basque Country, uses data analytics systems to exploit the information coming from the MES system implemented in their machining lab. For further information, refer to EXAM4.0, 2_The ERP Enterprise Resource Planning, adapted to the project needs (EXAM4.0, 2021).
ROLE OF THE DATA ANALYTICS IN THE EXAM40 CLF
The CLF that is going to be launched has divided its production process into 4 stages (product design, process engineering, production and assembly) as can be seen in the following image. Within these stages, data analytics is going to be incorporated in the production stage.
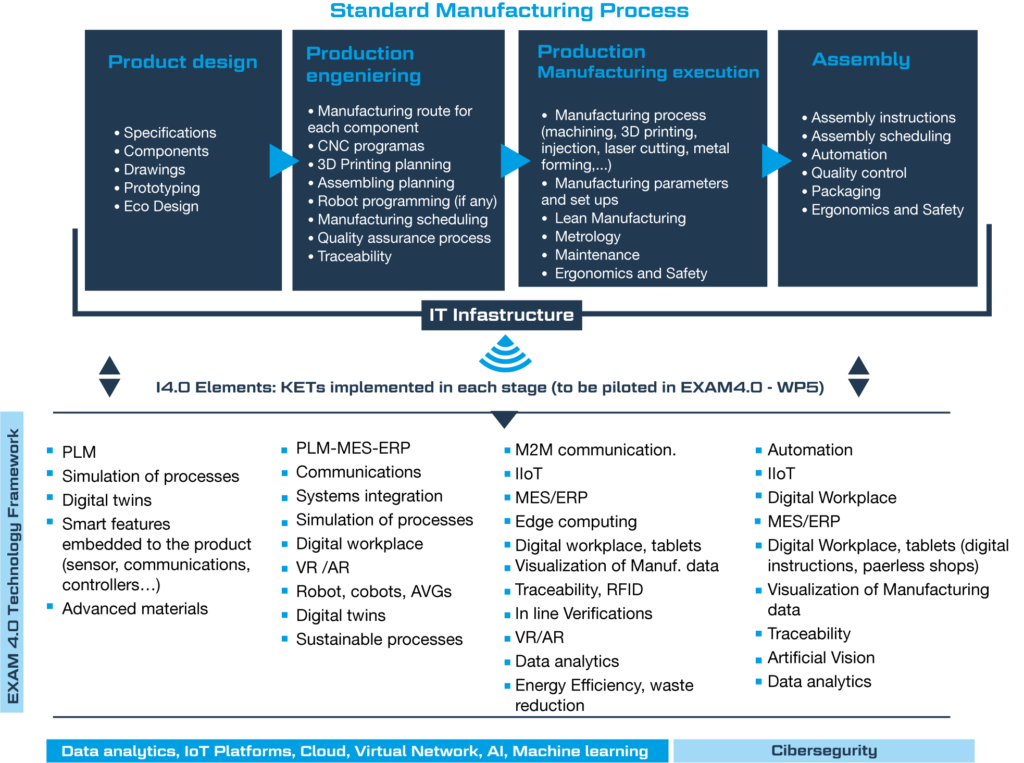
Data Analytics plays a key role in the EXAM 4.0 CLF to optimize (production) processes. Within continuous improvement, the methods and techniques of data analytics are important for identifying opportunities for streamlining work and reducing waste.
On the one hand, material and tool purchase predictions can be made through predictive analysis. On the other hand, the continuous analysis of the data of the production process will help to improve them.
Finally, the analysis of the data on the use of the machines will facilitate preventive and predictive maintenance avoiding uncontrolled stoppages.
Technology has made it possible for data analysis to be automated through mechanical processes and algorithms to generate effective and fast conclusions, allowing us to obtain information that can be used to improve processes and increase the efficiency of the organization or system (Netec, 2021).
These data analysis techniques allow us to identify metrics and trends that were previously lost in the volume of data, any type of information can have a data analysis to improve processes and detect errors in organizations.
Among the many benefits that we can find when integrating data analytics are:
- Data insight. It allows you to quickly view data in a big picture, with breakdowns and live data.
- Identify patterns by creating a panoramic image with the information, being trends more easily to be identified.
- Simple communication and understanding of ideas.
- Identify risks and opportunities before they affect the process.
- Create models for data analysis, reusable and live.
- Obtaining information to provide intelligent actions, improving customer participation and reducing costs in the organization.
The competencies acquired with data analytics can be classified into two groups:
Technical and soft competences.
The technical competences are the ones that are most closely related to the technical content to be acquired in the learning process of the students.
Among other technical competences the main ones are:
- Develop relevant programming abilities.
- Demonstrate proficiency with statistical analysis of data.
- Develop the ability to build and assess data-based models.
- Execute statistical analyses with professional statistical software.
- Demonstrate skill in data management.
- Apply data science concepts and methods to solve problems in real-world contexts and will communicate these solutions effectively.
As for the soft competences developed with data analytics are:
- Teamwork: being a collaborative tool, team members can plan their tasks and all have access to the production sheets, the control sheets….
- Digital awareness: they get used to virtual working environments, understanding the data obtained, managing it and drawing conclusions.
- Personal: autonomy, initiative, critical spirit, to be aware of the importance of good planning and to see how the decisions taken in the process affect them.
- Communication: between different students, the one who plans the production with the one who executes it, being aware of the importance of the different explanations (verbal and written) that are given within the production process and that can help achieve a better result.
COLLABORATION OPPORTUNITIES OPENED BY DATA ANALYTICS
Smart technologies, like machine learning, help manufacturers turn the data they’re already collecting into useful insights, to then take action on them. The results are tangible—from increased efficiency and higher quality to cost savings and minimized emissions. (Birand, 2021)
Indeed, data sharing is one of the key factors that allows collaboration among institutions. Furthermore, without an optimal data sharing infrastructure, the CLF model would hardly work.
On the one hand, when it comes to digitizing workstations, a lot of data is obtained about production, assembly and distribution processes. The accessibility to this data makes it easier for HVET that do not have such an infrastructure to work with real data. In this way, we bring the teaching-learning processes of other centres with less infrastructure closer to reality.
On the other hand, the availability of data created by one partner’s Labs for another partner, opens the door to set up working groups with students from different locations. Data analytics together with virtualization solutions, will lead CLF users to create joint projects among international student groups.
